This is part of a series comparing QuickBooks Online to QuickBooks Desktop. I’ll be showing you how to do common tasks in both version of QuickBooks. So you can decide which version would work better for your business.
In this post I’ll show you how to generate the Profit & Loss report in both QuickBooks Desktop and QuickBooks Online. I’ll also show you how to view those reports as month-over-month, and export the them as an excel file.
We’ll start with QuickBooks Desktop.
Generating a Profit & Loss Report in QuickBooks Desktop
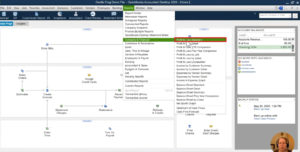
To generate a Profit & Loss Report in QuickBooks Desktop you’ll use the file menu.
Click Reports -> Company & Financial -> Profit & Loss Standard
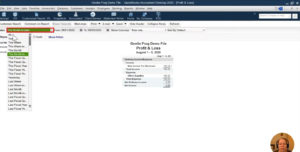
When the report generates it’ll default to a time period of “This Month-to-date.”
You can change this by click the drop-down next to Dates. I like to select All.
The report itself is very simple in QuickBooks Desktop. You can easily see your income, expenses and cost of goods sold.
One thing the Profit & Loss report is commonly used for is to compare income and expenses month-over-month, or year-over-year.
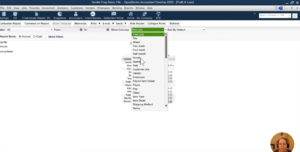
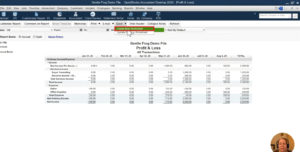
To view month-over-month in QuickBooks Desktop click the Show Columns drop-down menu and select Months.
The report will now show you totals by month.
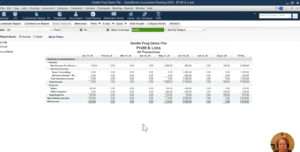 You can export the Profit & Loss report as an excel spreadsheet.
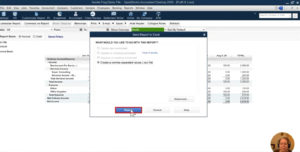
To do this find the Excel drop-down in the menu that’s below the ribbon menu and select “create new worksheet.”
You’ll get a pop-up that gives you options for saving your Excel file.
Generating a Profit & Loss Report in QuickBooks Online
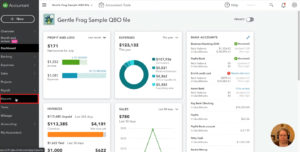
To generate a Profit & Loss report in QuickBooks Online click on Reports in the left-hand menu.
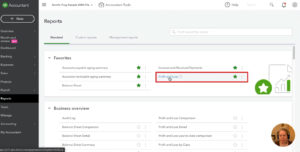
On the Reports page you’ll find the Profit & Loss under Business overview.
I use this report often enough that I’ve added it to my favorites. Favorites show up at the top of the Reports screen. You can add a report to your favorites by clicking the little green star next to it.
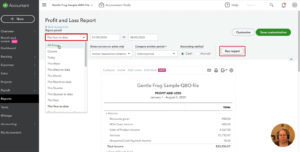
To change the date range for this report like, we did in QuickBooks Desktop, you’ll need to scroll up.
Above the report you’ll find the customization options including the date drop-down. Once again, I like to view All Dates.
Now click the Run report button to the right to generate the report.
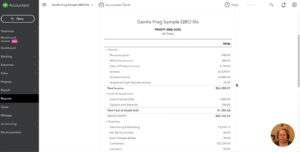
The Profit & Loss report in this example may look more complex than in QuickBooks Desktop. That’s because I use different example files for each. The QuickBooks Online example file I use has a lot more data in it than the Desktop example file.
Both QuickBooks Desktop and Online show Income at the top, Cost of Goods Sold in the Middle, and Expenses at the bottom.
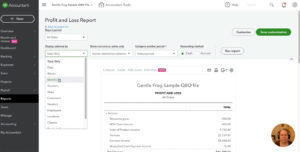
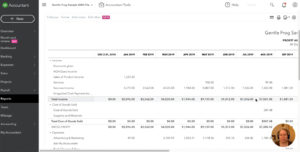
To view month-over-month in QuickBooks Online click the “Display columns by” drop-down and select Months. Then click the Run report button.
The report will now show you data for each month.
Let’s save this report as an Excel file.
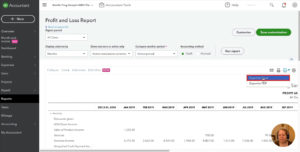
At the top right of the report are a few icons. Click on the second icon to the right. The icon that looks like a piece of paper with an arrow flying out of it.
This brings up the option to export as an Excel or PDF file.
I hope this gives you an idea of what the Profit & Loss report looks like in both QuickBooks Desktop and QuickBooks Online.
As I go through this series comparing the two versions of QuickBooks I want to emphasize that neither software is better or worse. But you may have a preference for one over the other.
Feel free to comment and let me know which version you prefer.
☕ If you found this helpful you can say “thanks” by buying me a coffee…
https://www.buymeacoffee.com/gentlefrog
If you’d like to watch me walk you through this Profit & Loss comparison check out the video below:




One Response